Pie Chart Example
Audience
Audience: Administrators and Read/Write Users
Overview
Administrators and Read/Write users can generate a Pie Chart using employee data and display it on the background of chart.
In this example, we will create a Pie Chart that represents the percentages of employees in a specific location.
Creating a Pie Chart
Log in to OrgChart.
Open the Master Chart containing the employee data that you would like to display in a Pie Chart.
Click on the Mode Switcher icon, and then click on the Setup option.
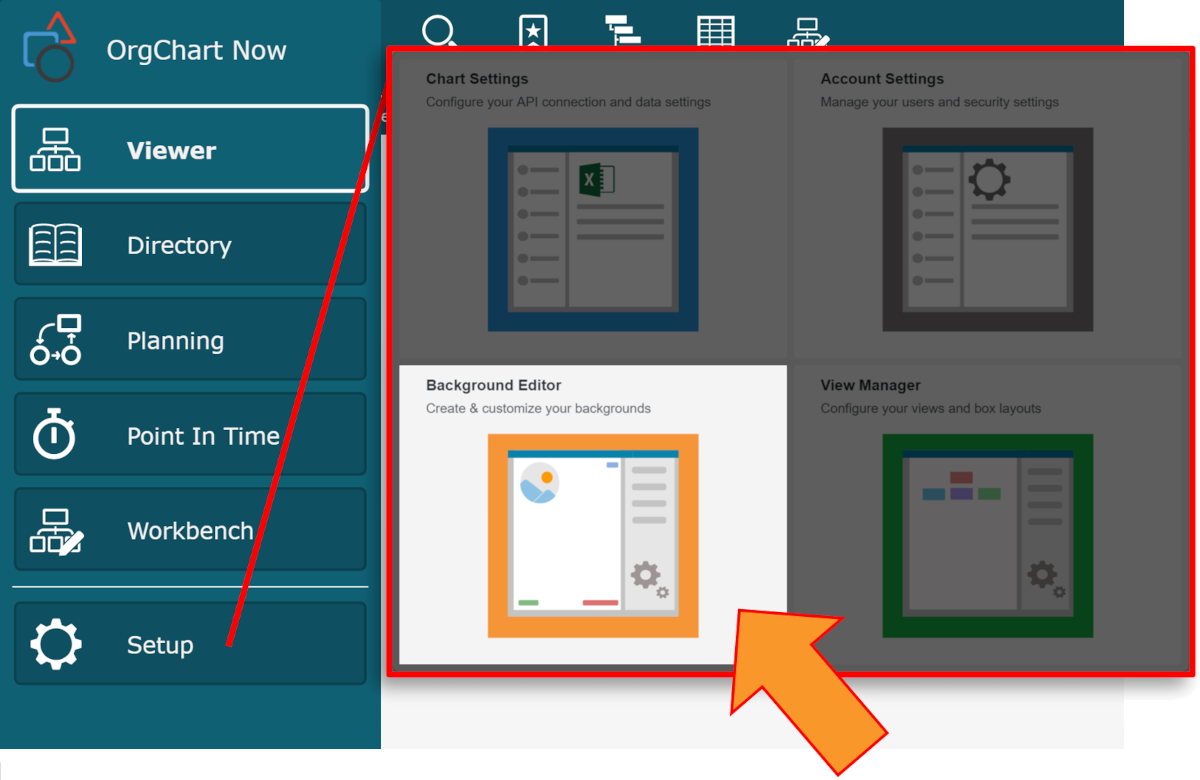
Click on the Background Editor, and then create a new background, or open an existing one.
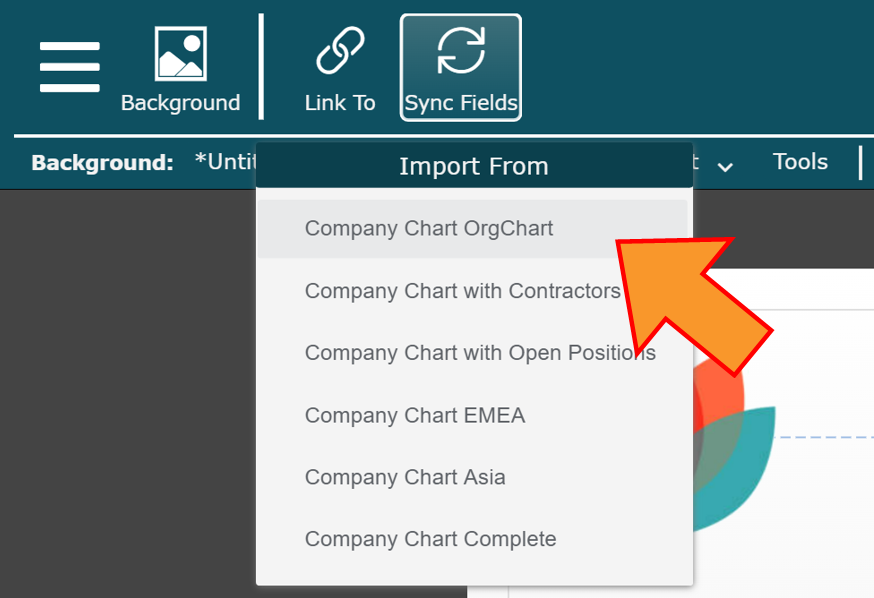
Click on the Sync Fields icon (in the Top Toolbar), and then select the Master Chart that contains the field you'd like to display in the Pie Chart.
Click on the Tools button, if the Editor Tools panel is not yet displayed.
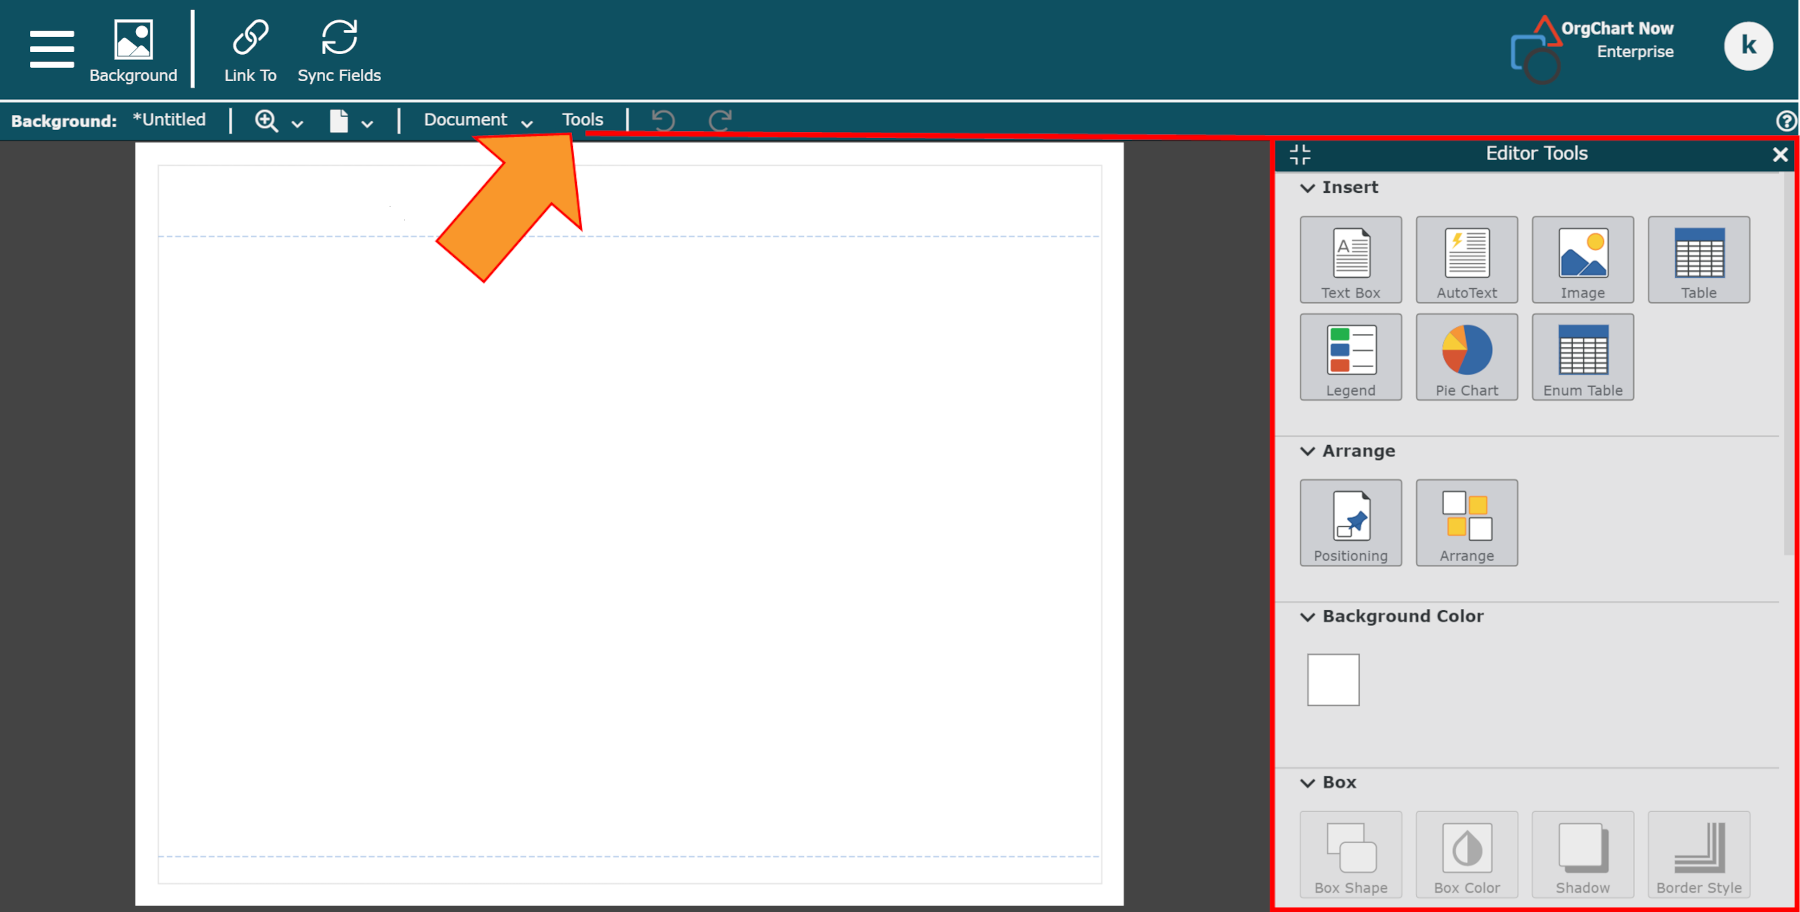
Click on the
 icon (under the Insert heading), and then click on the background canvas to place the element.
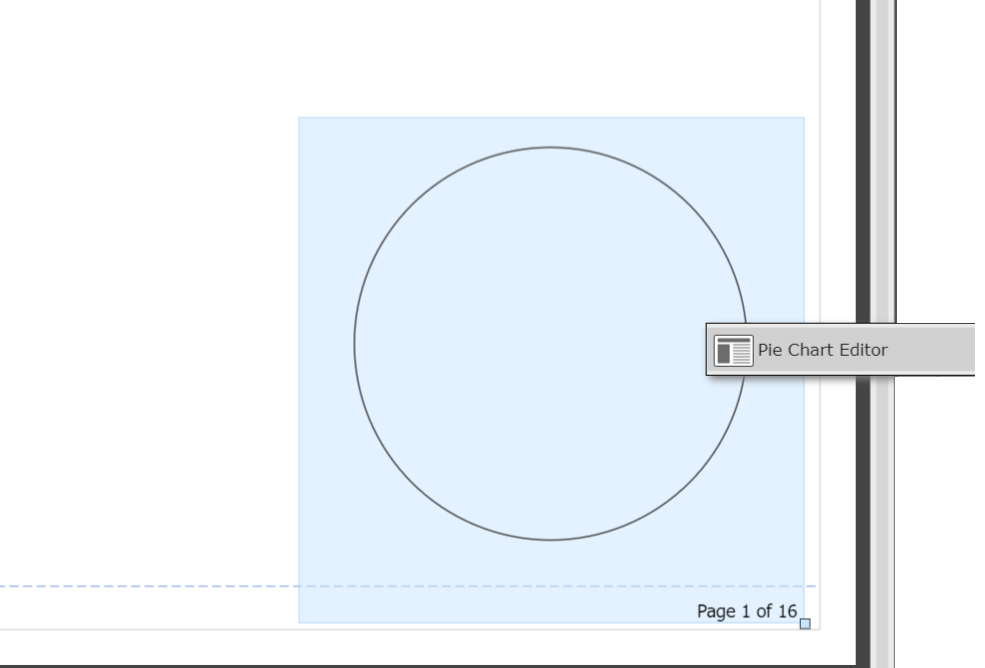
Click and drag the small blue box (in the bottom right corner of the Pie Chart element) to resize it.
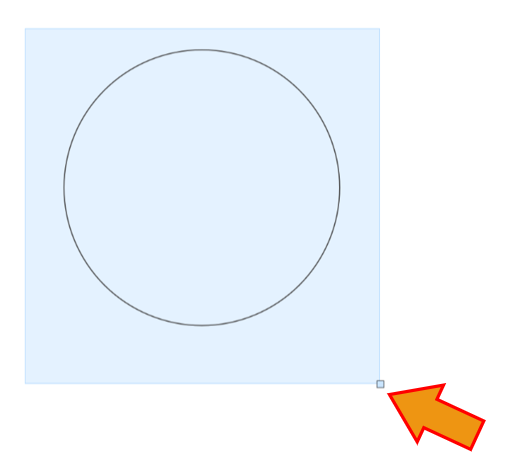
Right-click on the Pie Chart element, and then click on Pie Chart Editor. The Pie Chart Editor is displayed.
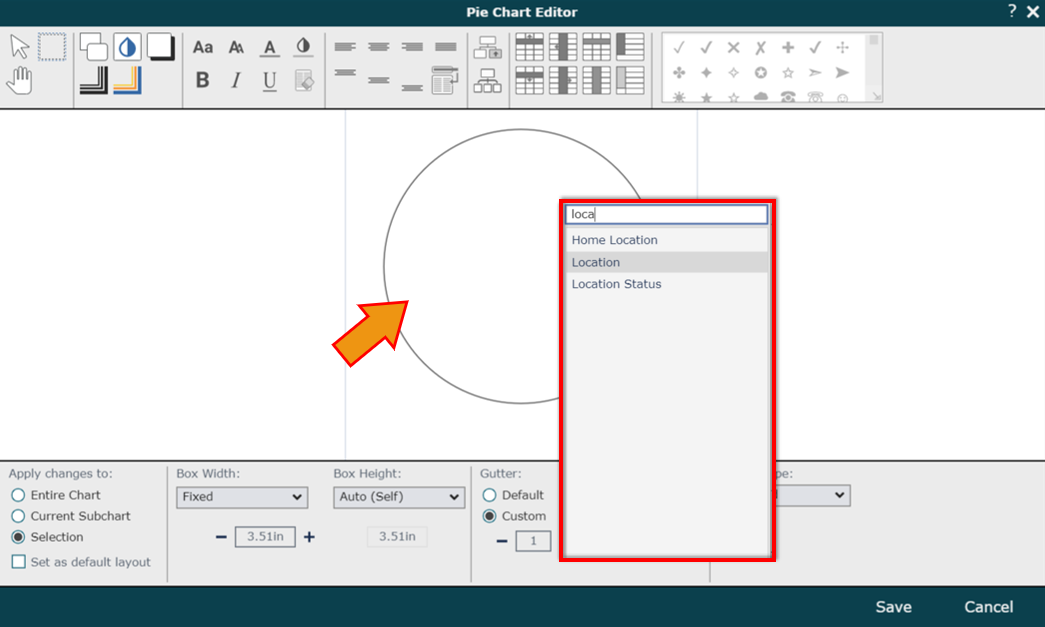
Right-click in the Pie Chart element, and then search for the field you would like to display.
The Pie Chart element auto-populates.
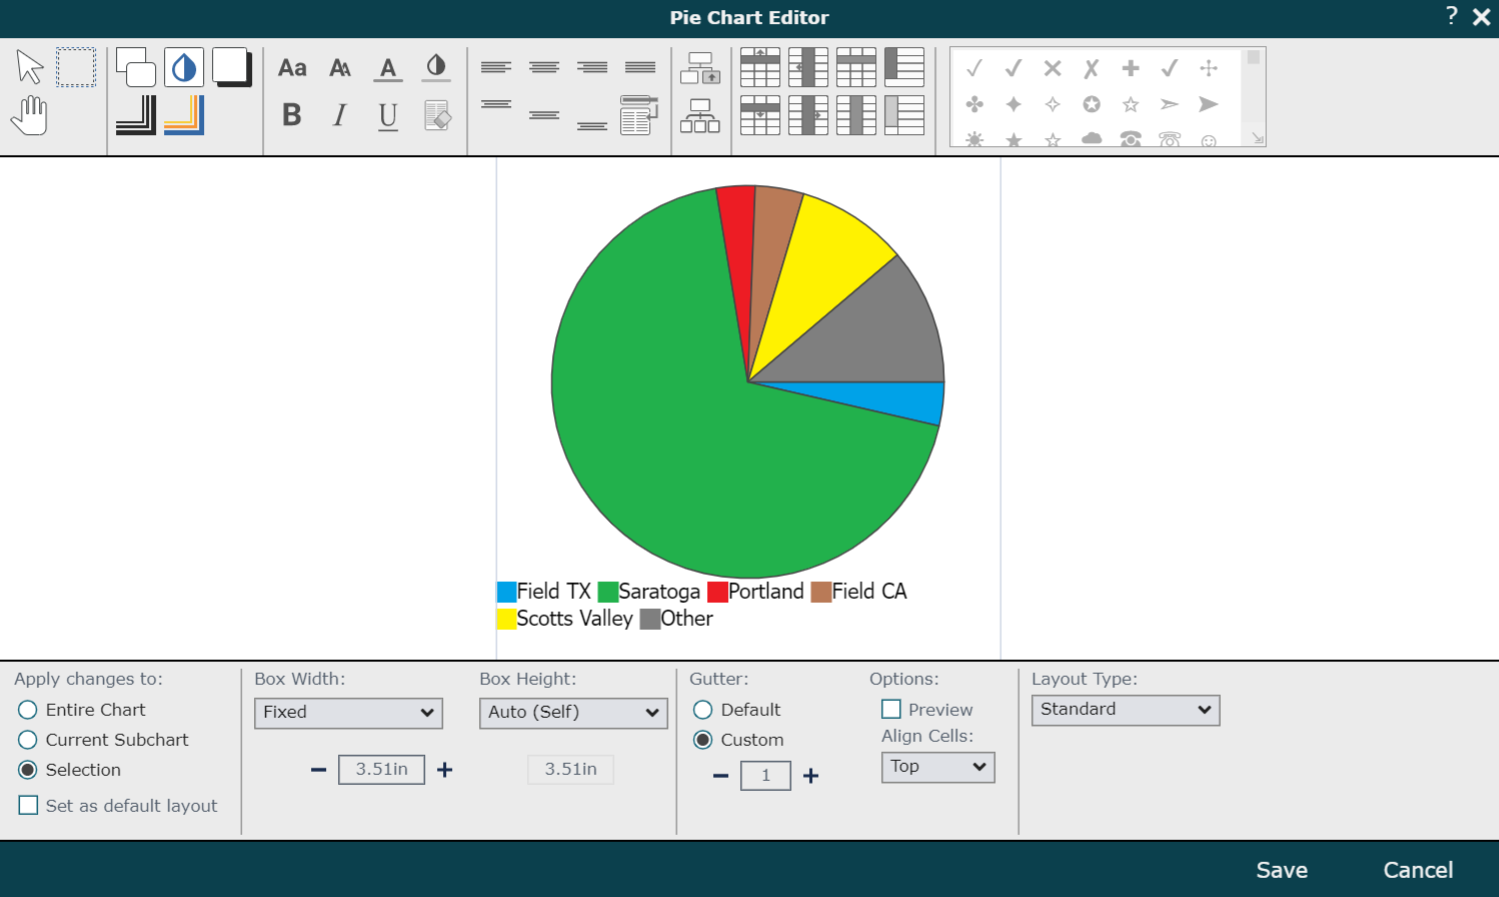
Click Save. The Pie Chart is displayed on the background.
Right-click on the Pie Chart element, and then select the Pin Position option.
Use the Pin Position tool to pin the Pie Chart to a corner of the chart. This will ensure that the Pie Chart element stay in the same place when the page is resized.
Click on the Document menu, and then click on the Save Background As... option.
Enter a name for the background in the File Name text box, and then click on Save.
The background is now available to link to a Master Chart, apply to a Chart Document, or utilize in a View.