Aggregated Fields
Audience
Audience: Administrators
Overview
Aggregated Fields are formulas that are created using one or more fields from your source data to calculate employee metrics. Once an Aggregated Field is created, Administrators and Read/Write users can use it in an Enumerated Table to display on a chart background.
Accessing The Aggregated Field Editor
Log in to OrgChart.
Click on the Mode Switcher icon in the Top Toolbar, and then select the Setup option. The Setup panel is displayed.
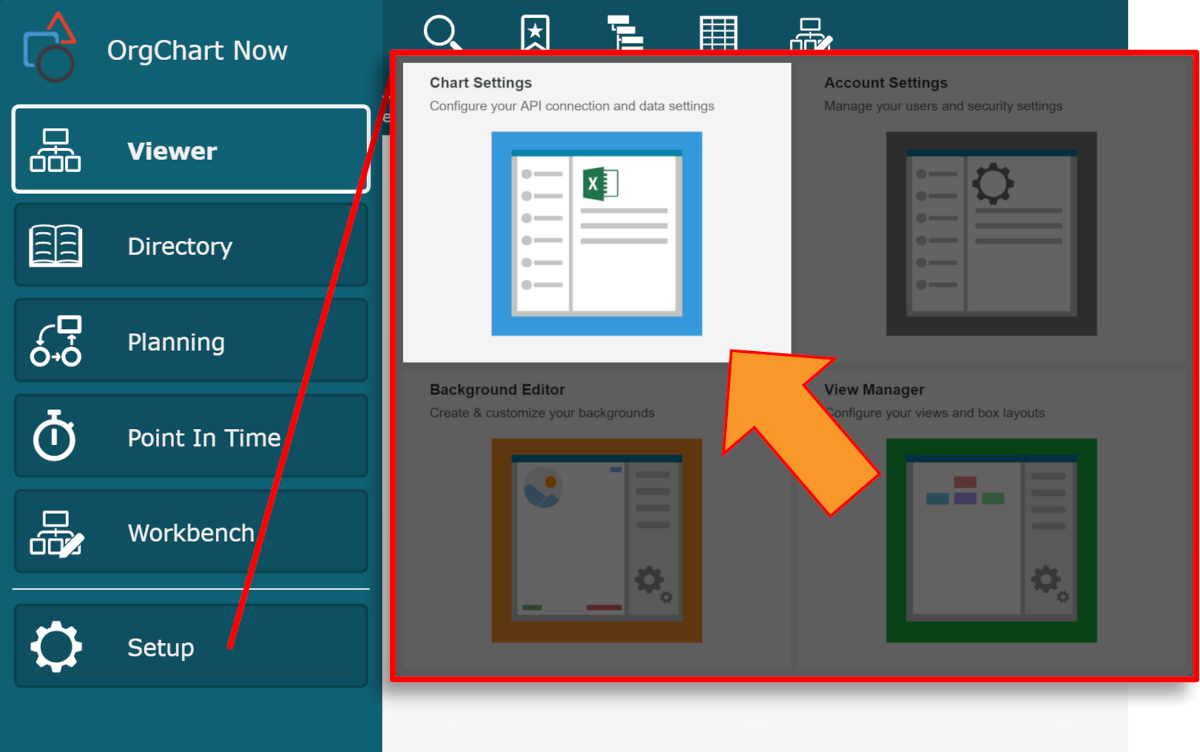
Click on the Chart Settings tile, and then click on the Fields & Formulas tab in the left side menu.
Click on the f(x) Create button, and then select the Aggregated Field option.
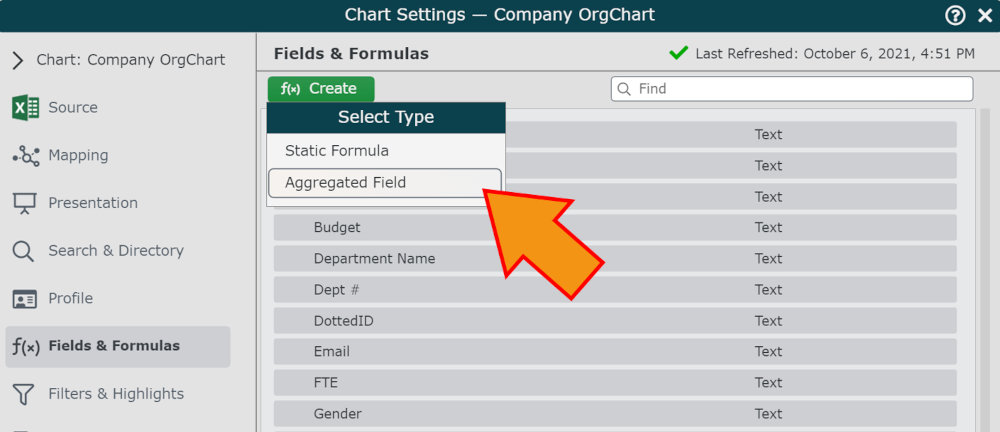
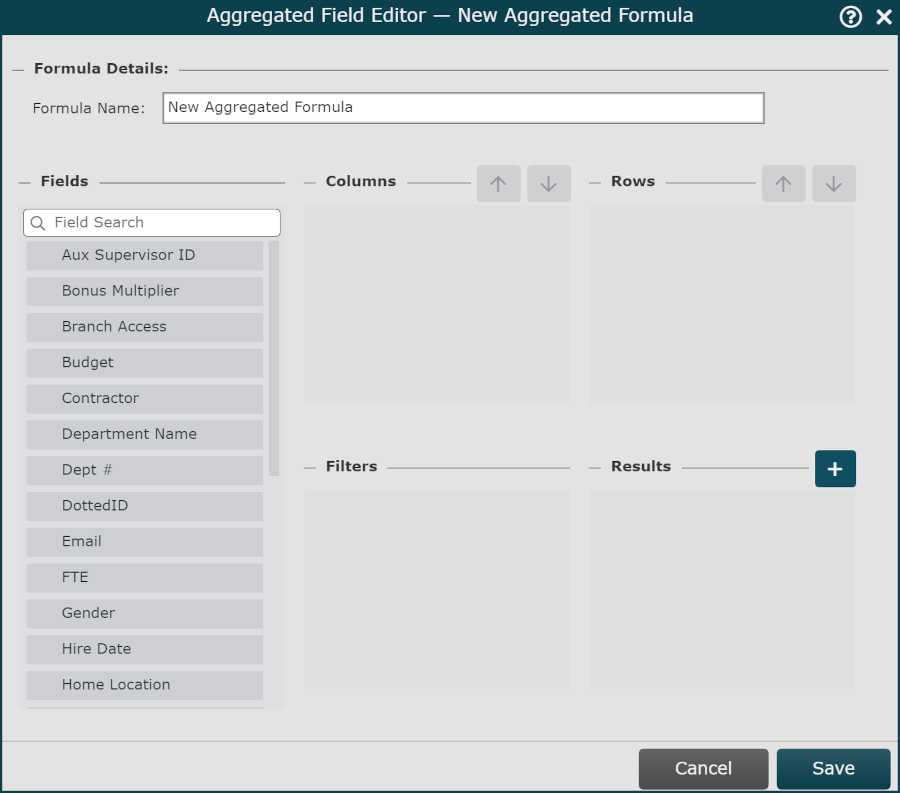
The Aggregated Field Editor is displayed.
Defining an Aggregated Field
Open the Aggregated Field Editor (following the steps in the section above), and then enter a name for the Aggregated Field in the Formula Name text box.
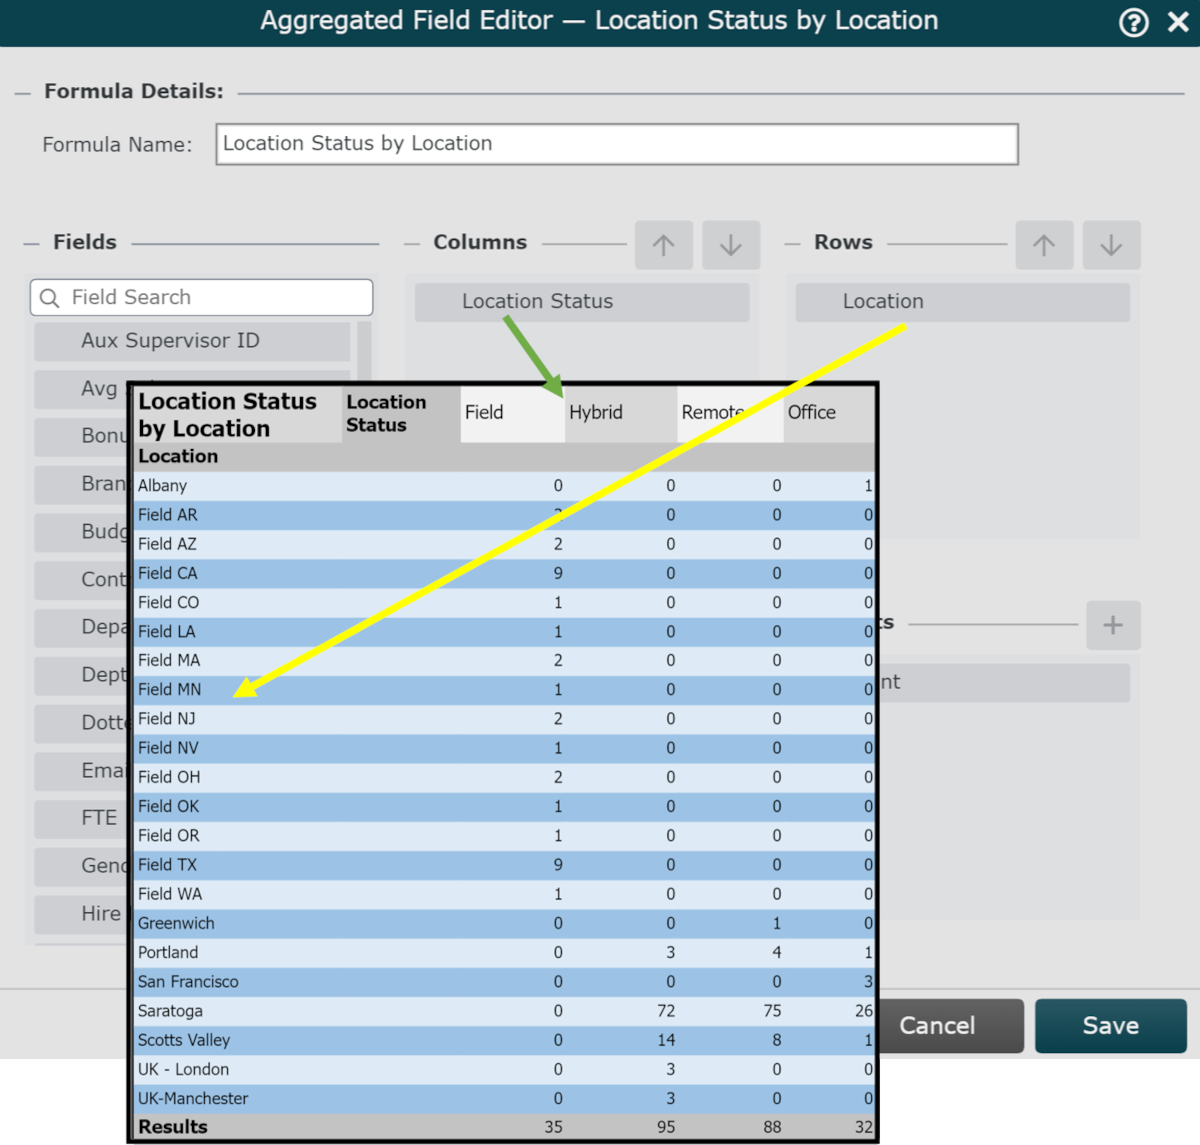
Click on a field in the Fields section, and then drag it into either the Columns or Rows section.
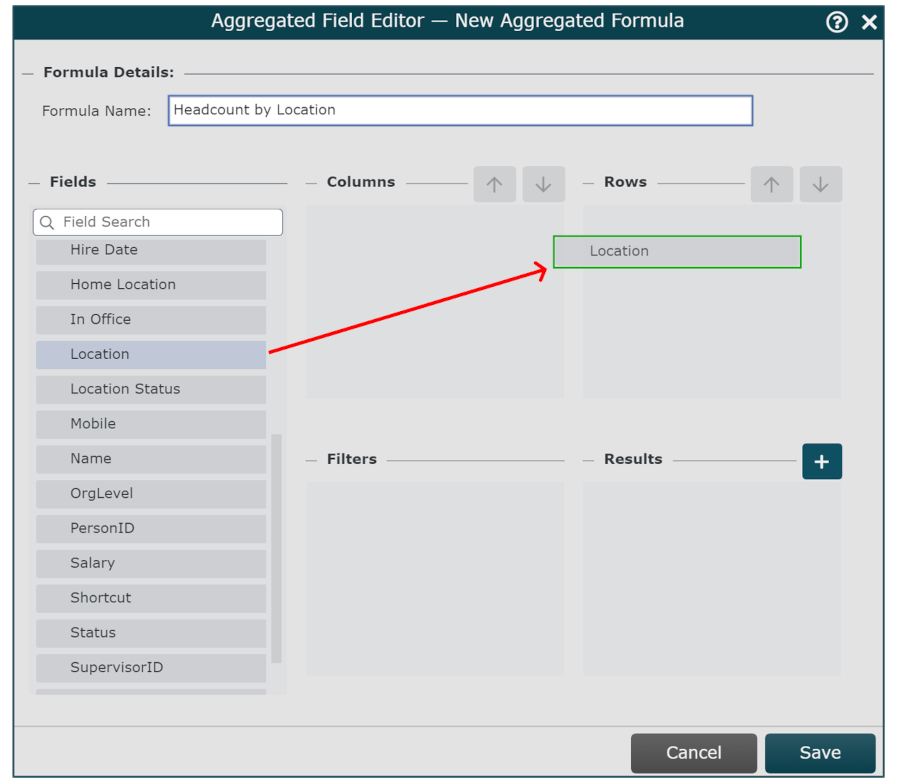
Optionally, click and drag other fields into the Columns or Rows sections, to calculate employee metrics based on multiple variables.
Note
Once more than one field is present in the Columns or Rows sections, the
 and
and  icons are illuminated.
Select a field, and then click on the
or icon in the corresponding section to move it up or down in the list.Click on the
 icon (to the right of the Results heading), and then select an operation from the dropdown menu.
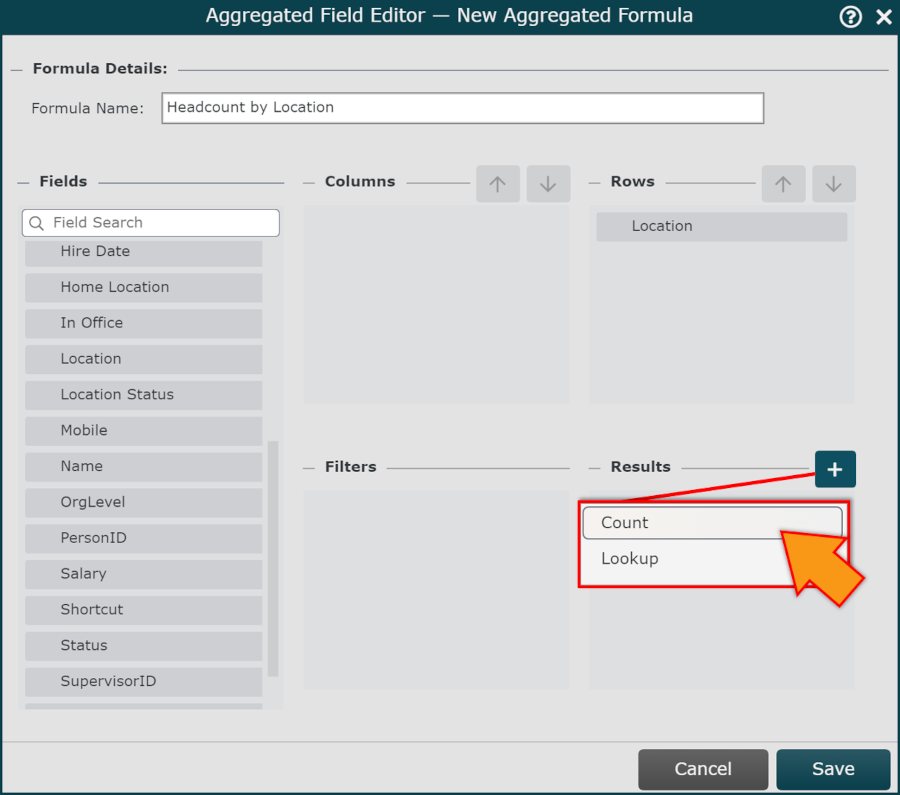
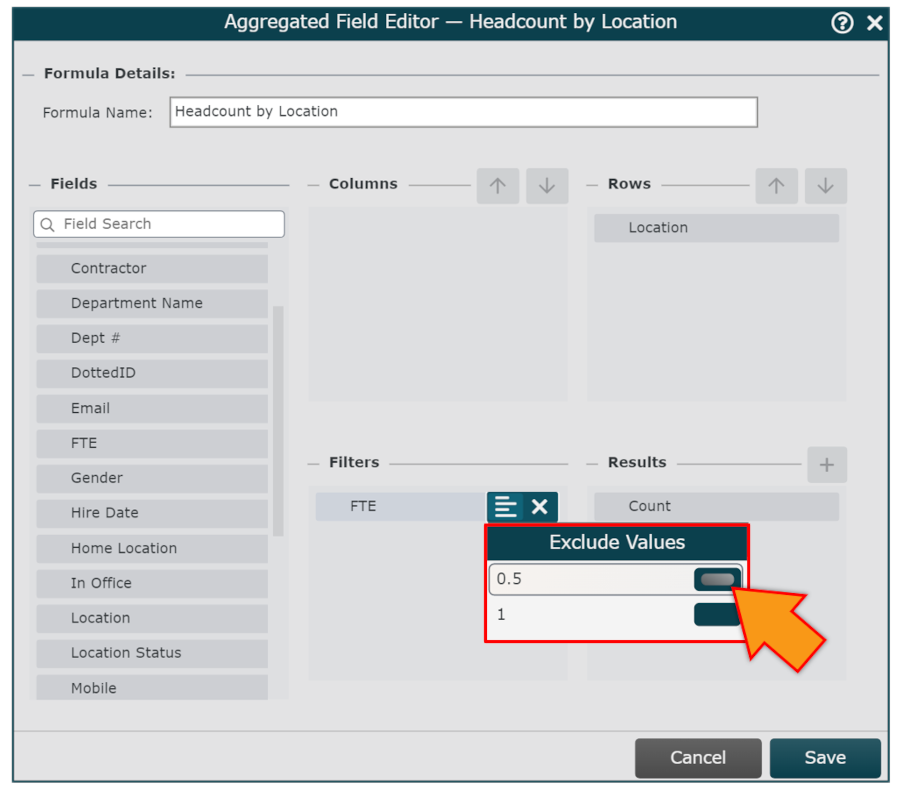
Optionally, click on a field and then drag it into the Filters section.
Mouse over the field in the Filters section, and then click on the
 icon. A list of values associated with the selected field is displayed.
Toggle the values that you wish to exclude from the Aggregated Field calculation.
Click on Save, and then Refresh. The new Aggregated Field is added to the list of Fields & Formulas.
Important
If an Aggregated Field breakdown result exceeds the maximum capacity of 25 Columns x 25 Rows, you will see a  icon to the left of the Aggregated Field.
Click on the  icon to refine the Aggregated Field configuration in order to use it.
Note
Employees that do not have a value populated for one of the fields used to create the Aggregated Field will not be included in the calculation.
Auxiliary employees (employees who report to more than one supervisor) will only be counted once.
Note
If you need to edit the configuration of an Aggregated Field after its initial creation, ensure that you always Save, and then Refresh the chart to preserve your changes.
Aggregated Field Examples
The following articles provide step-by-step instructions on how to create various types of Aggregated Fields: