Compare Charts
Note
This feature is deprecated in favor of the Planning module, which is purpose-built to highlight organizational changes.
Overview
The Compare Charts function generates an Excel spreadsheet detailing the differences between an open Chart Document, and another saved Chart Document.
Accessing Compare Charts
The Compare Charts utility can be accessed by clicking on the Compare Charts option in the Document dropdown menu in Workbench.
Compare Charts
To use the Compare Charts utility:
Open a saved Chart Document.
Click on the Document menu, and then select the Compare Charts option.
Select a a Chart Document from the File Manager which will be compared to the currently open Chart Document.
An Excel file containing a list of all changes is generated.
Comparison File
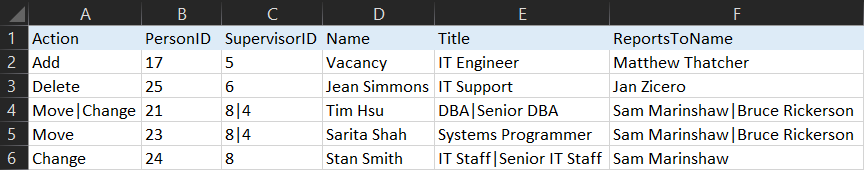
The Compare Chart utility will generate an Excel file detailing the differences between two charts. The first column in the file is called Action. It describes how a specific record has changed from Chart "1" as compared to Chart "2":
Add | A record has been added to Chart "2" |
Delete | A record has been deleted from Chart "2" |
Move | The supervisor of a record has changed |
Change | The content of a record has been changed (e.g. changed title) |
Move|Change | The supervisor and content of a record has been changed |
The other columns in the spreadsheet correspond to the fields defined in your chart. Changed values contain the "|" separator. For example, a changed title would be shown as <Chart 1 Title>|<Chart 2 Title> (e.g. Manager|Director).
Example
The example below details the difference between two charts. For example, in the third row, Tim Hsu's supervisor and title have changed (with respect to the compared charts).