Static Formulas
Audience
Audience: Administrators
Overview
An administrator can create custom formulas to display in chart boxes, on a chart background, or in the Profile panel.
Accessing the Formula Editor
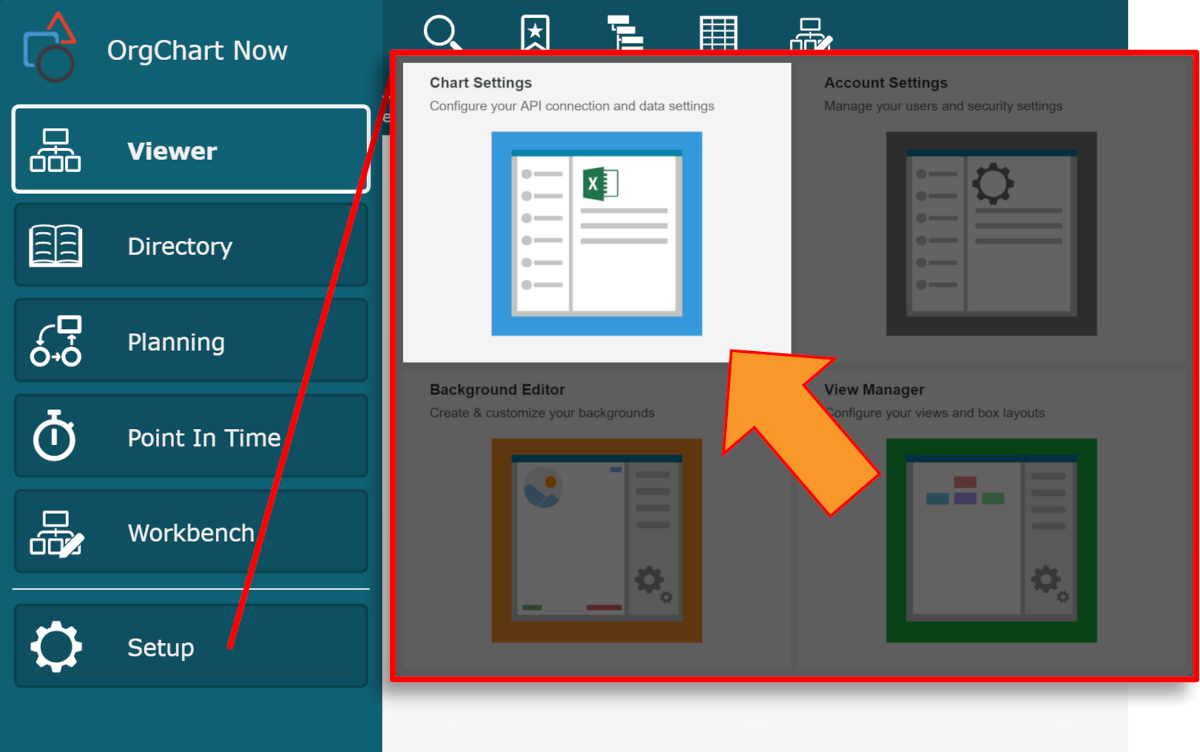
Click on the Mode Switcher icon in the Top Toolbar, and then select the Setup option. The Setup panel is displayed.
Click on the Chart Settings tile.
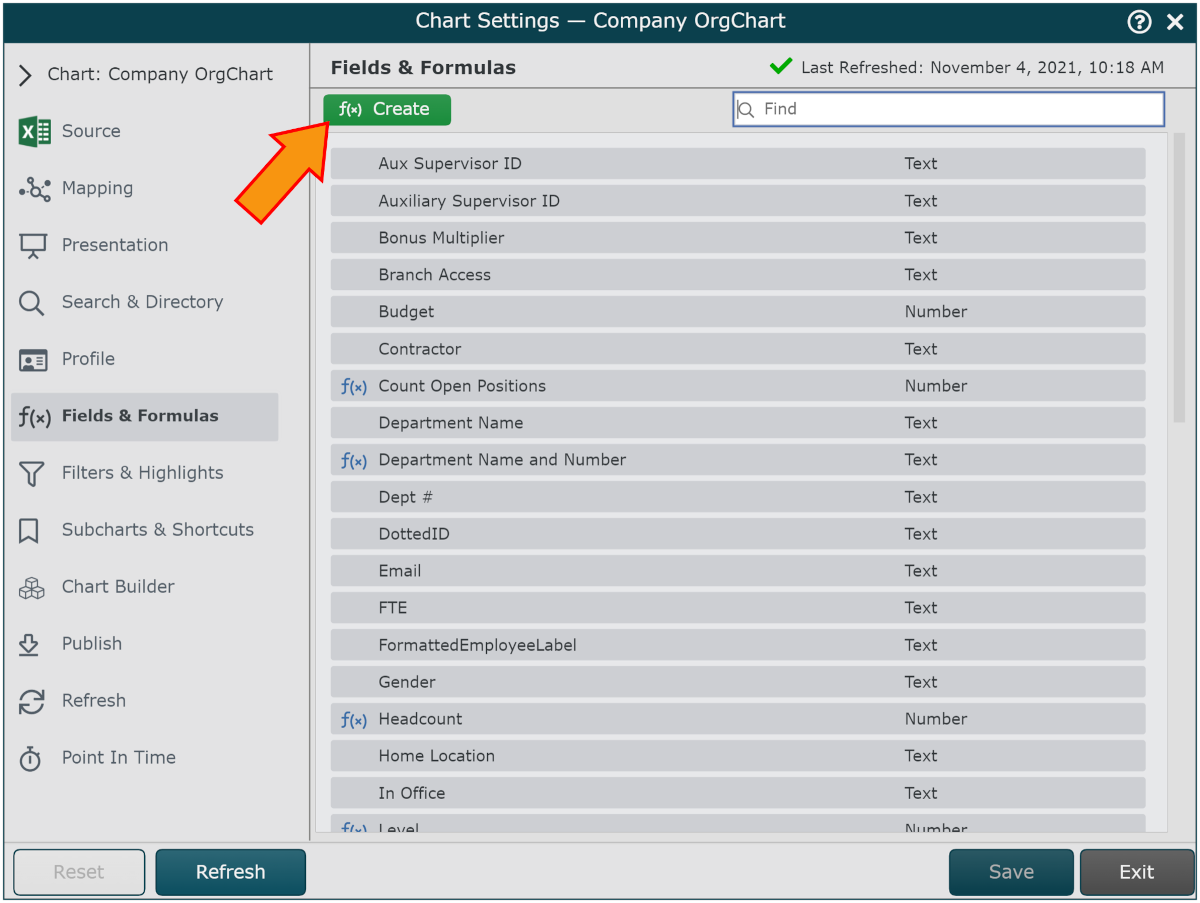
Select the Fields & Formulas option from the left side menu.
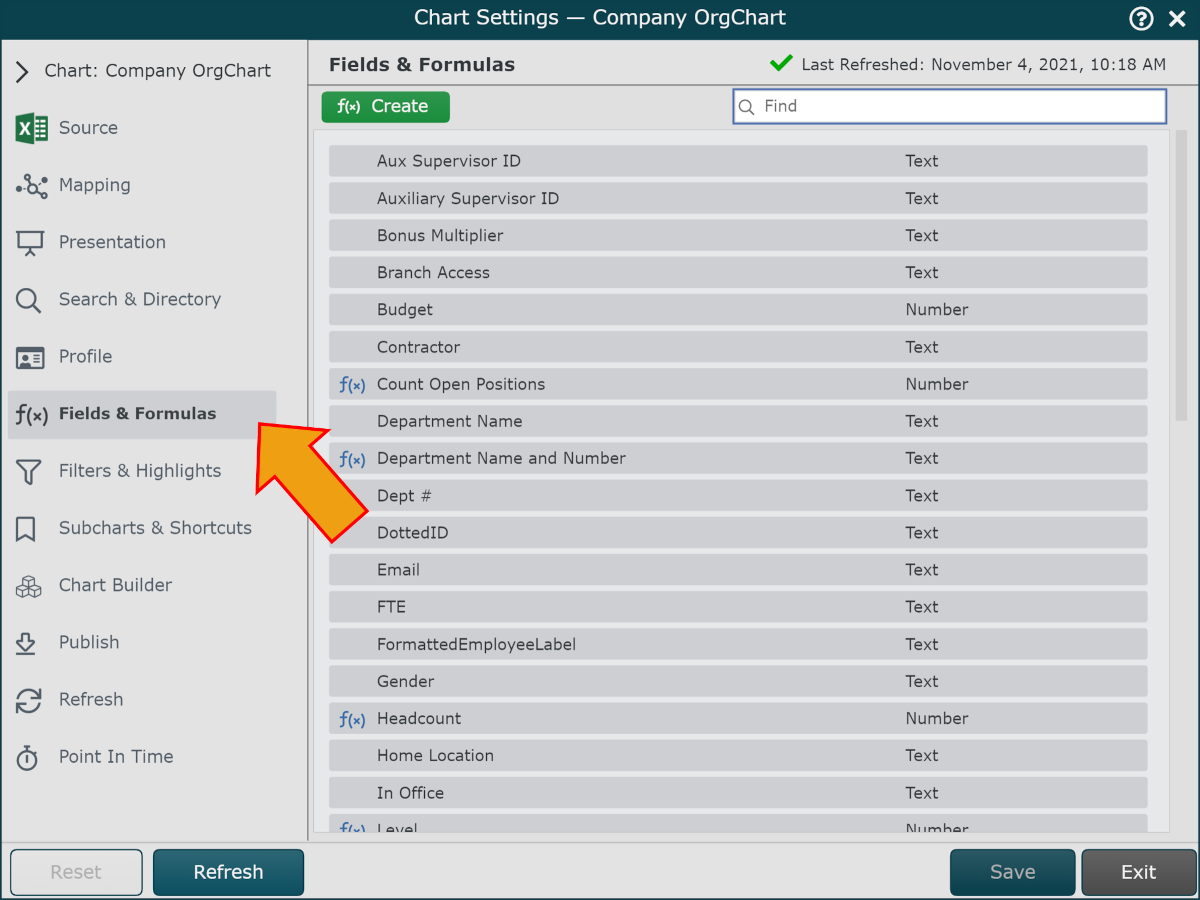
The following options are available:
Click on the + f(x) button to add a new Static Formula.
Mouse over an existing formula and then click on the
 icon to modify field properties.
Mouse over an existing formula and then click on the
 icon to edit the configuration.
Note
Note: Predefined formulas cannot be edited.
Defining a Static Formula in OrgChart Viewer
The following example demonstrates how to create a formula that counts open positions.
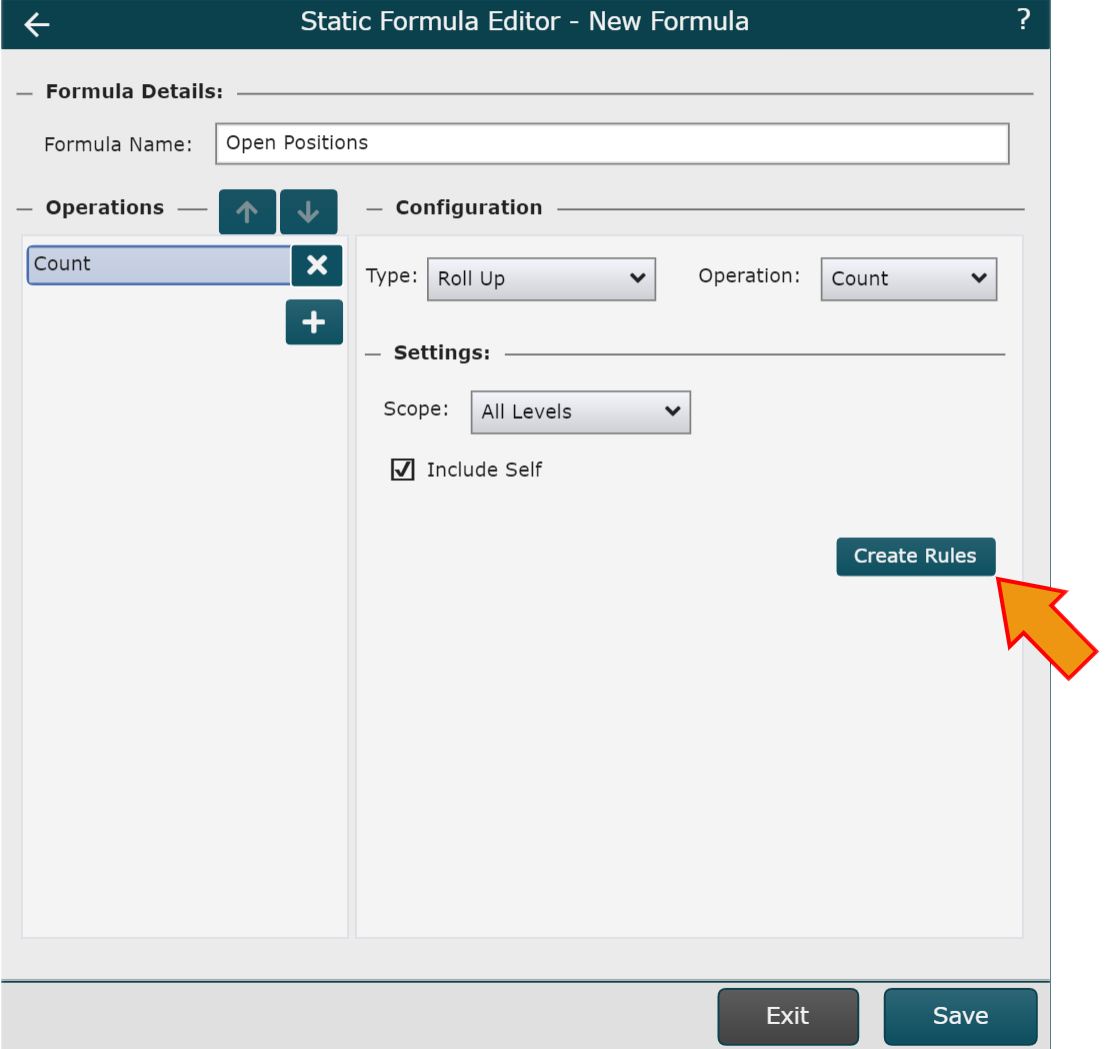
Click on the green f(x) Create button in the top left corner, and then select the Static Formula option. The Formula Editor panel will be displayed.
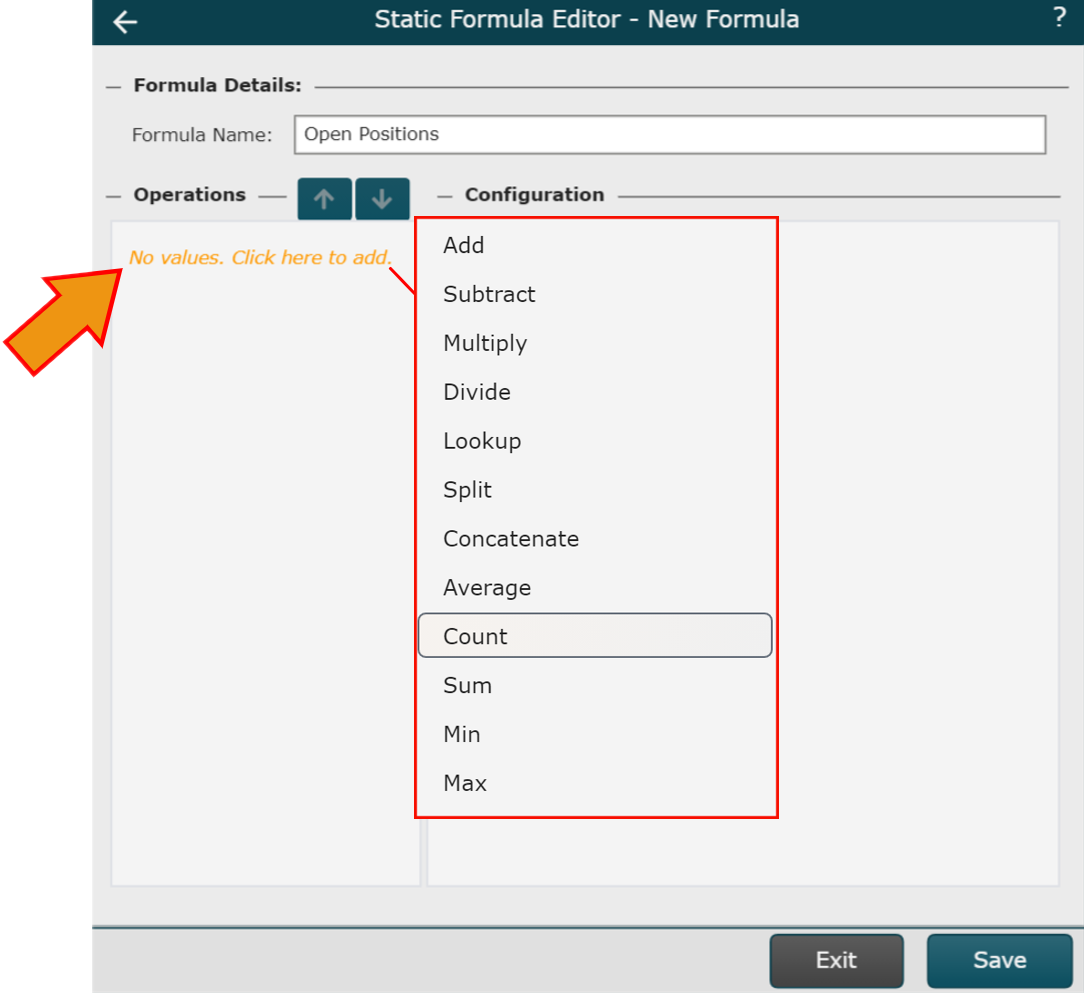
Enter a name the new formula (e.g. Open Positions) in the Formula Name textbox.
Click on the No values. Click here to add hyperlink, and then select the Count option from the dropdown menu.
Click on the Scope dropdown menu, and then select All Levels.
Check the Include Self checkbox.
Click on the Create Rules button.
Configure the rule as shown below. In this example, a vacancy is identified when the employee name is set to 'Vacant.' This rule definition will vary based on your source data.
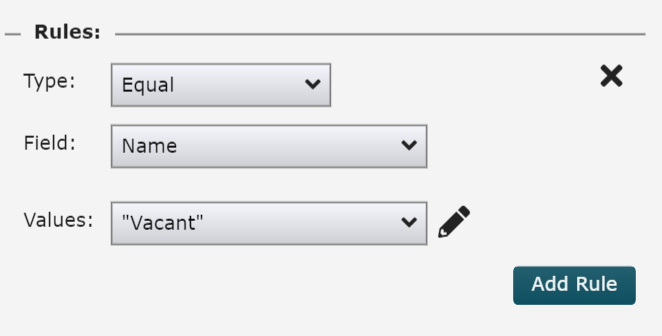
Click Save.
Formatting a Formula
You can control how a formula is displayed (e.g. the number of decimal places to display). For this example, we’ll continue to work on our ‘Open Position’ count formula.
Note
Note: Reference Field and Formula Properties section of the Fields & Formulas article for more information on available presentation options.
Mouse over a formula, and then click on the
 icon. You will be presented with formula display options.
Click on the Field Type dropdown, and then select the Number option. This will ensure that the formula results display as a number.
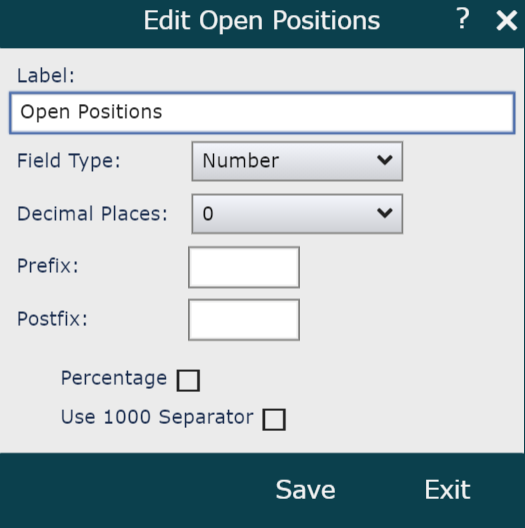
Click Save.
Formula Examples
The following articles provide step-by-step instructions on how to create various types of formulas:
Complex Operations
You can include multiple operations in a single formula. Operations are performed top to bottom.
 | Add an additional operation |
 | Mouse over to remove an operation |
 | Move an operation up |
 | Move an operation down |
Available Operations
Operation | Description |
|---|---|
Add | Add the previous two values |
Subtract | Subtract the previous two values |
Multiply | Multiply the previous two values |
Divide | Divide the previous two values |
Lookup | Lookup a record based on a field value |
Split | Spilt a string based on a separator character |
Concatenate | Merge two or more fields together |
Average | Average a field within an org chart branch |
Count | Count boxes within an org chart branch |
Sum | Sum a field within an org chart branch |
Max | Max value for a specified field within an org chart branch |
Min | Min value for a specified field within an org chart branch |