Percent Example
Audience
Audience: Administrators
Overview
A Percent Aggregated Field counts the number of employees with a value for the selected field(s), divides the number by the total amount of employees, and then displays the results as percentages.
For example, you could create a Percent Aggregated Field to find the percentage of women and men in each department.
The following article provides step-by-step instructions for creating a Percent Aggregated Field.
Defining a Percent Aggregated Field
Log in to OrgChart.
Click on the Mode Switcher icon in the Top Toolbar, and then select the Setup option. The Setup panel is displayed.
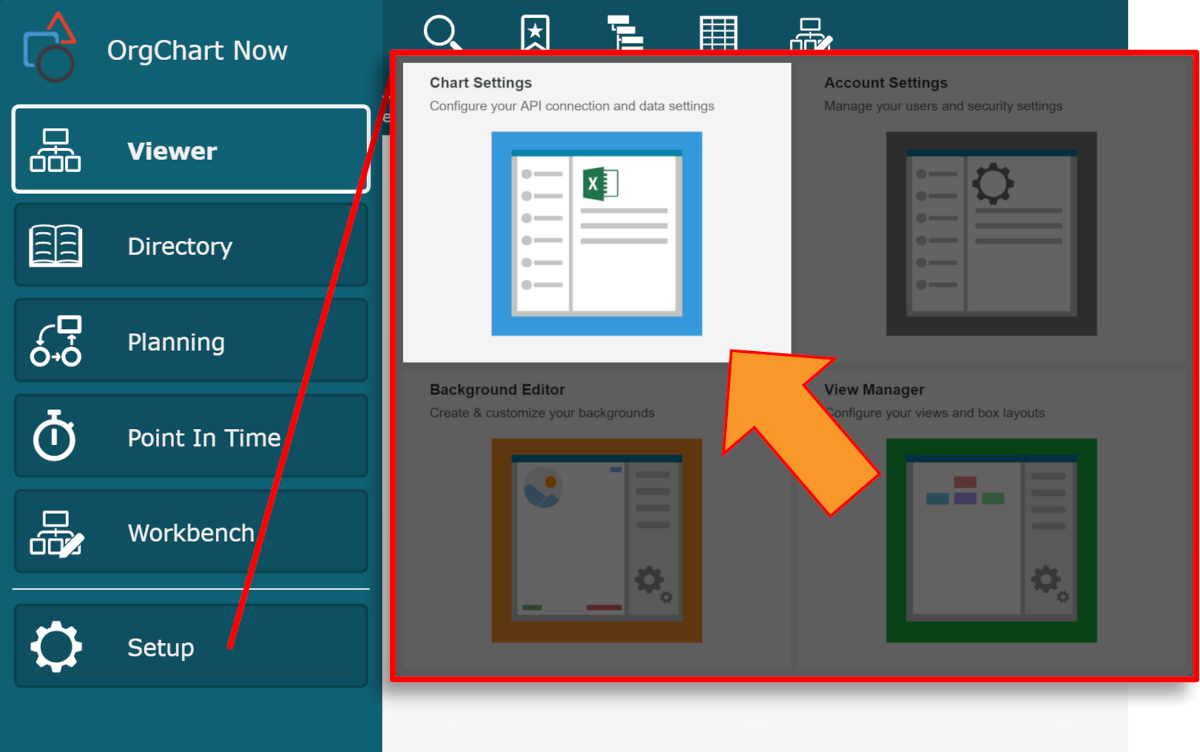
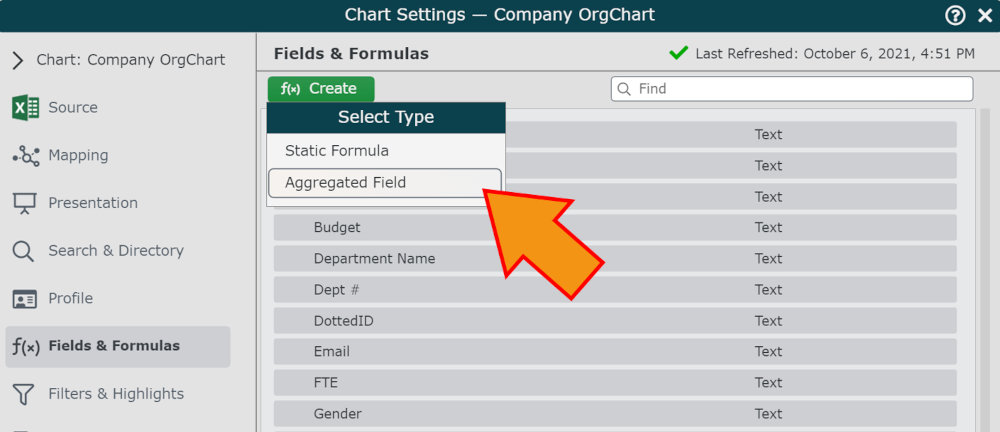
Click on the Chart Settings tile, and then click on the Fields & Formulas tab in the left side menu.
Click on the f(x) Create button, and then select the Aggregated Field option.
Enter a name (e.g., Gender Breakdown) for the Aggregated Field in the Formula Name text box.
Select a field (e.g. Gender) from the Fields section, and then click and drag it into the Columns section.
Select another field (e.g. Department Name) from the Fields section, and then click and drag it into the Rows section.
Click on the
 icon (to the right of the Results heading), and then select the Count option.
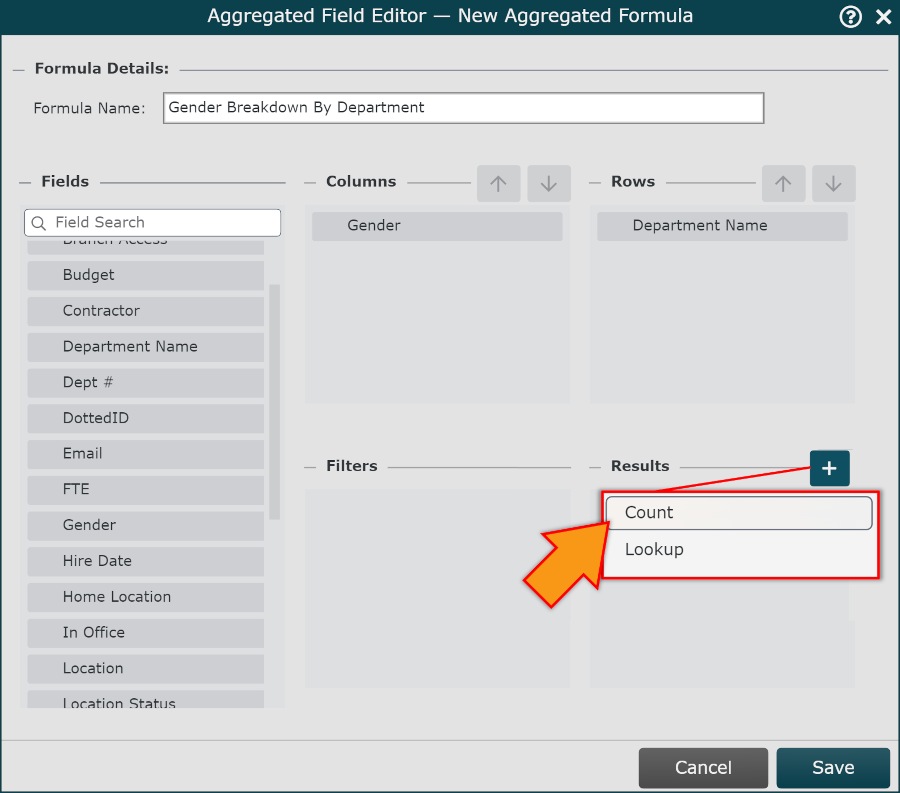
Note
You can filter the values that are included in the Aggregated Field calculation. Reference steps 6 and 7 of the Aggregated Fields article for more information on filtering.
Mouse over the Count operation, and then click on the
 icon. The
  icon is displayed.
Click on Save. The Aggregated Field is added to the list of Fields & Formulas .
Click on Save and then Refresh. The field can now be used in an Enumerated Table.