Level Charts
Audience
Audience: Administrators
Overview
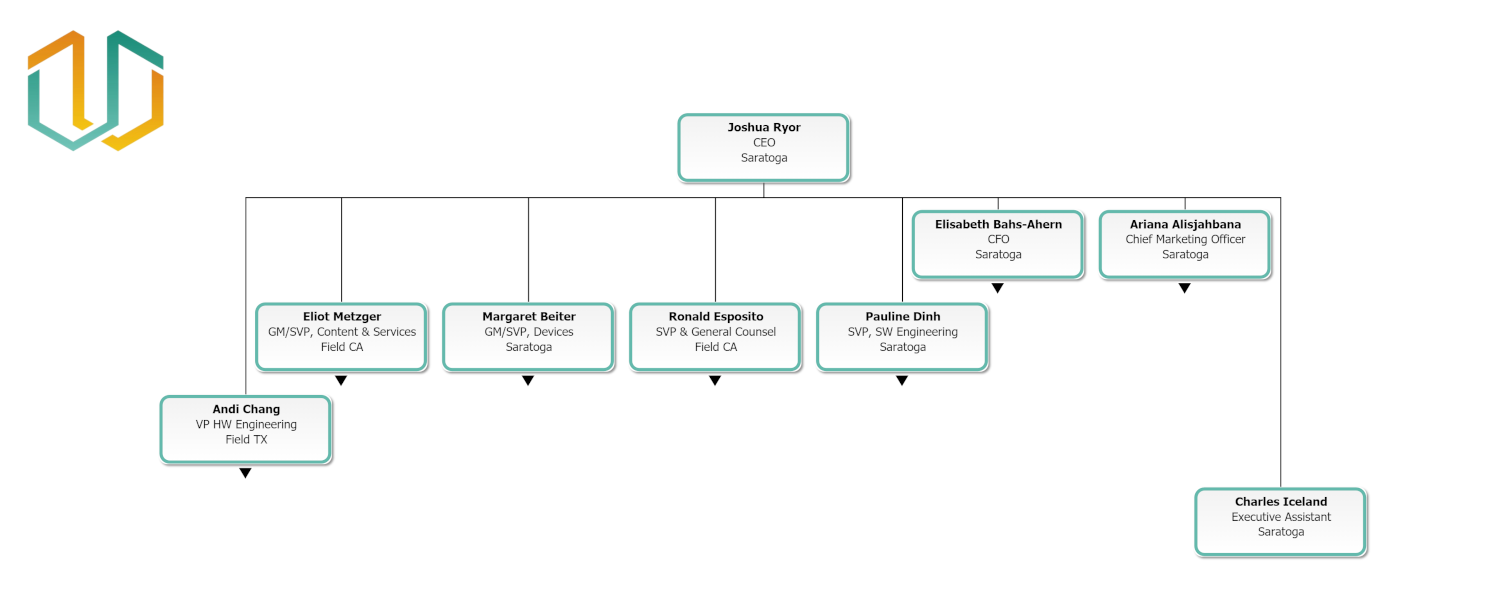
A "level chart" is a chart in which employee records are displayed at varying heights, depending upon an assigned value in the data.
Creating A Level Chart in Viewer
Click on the Mode Switcher icon in the Top Toolbar, and then select the Setup option. The Setup panel is displayed.
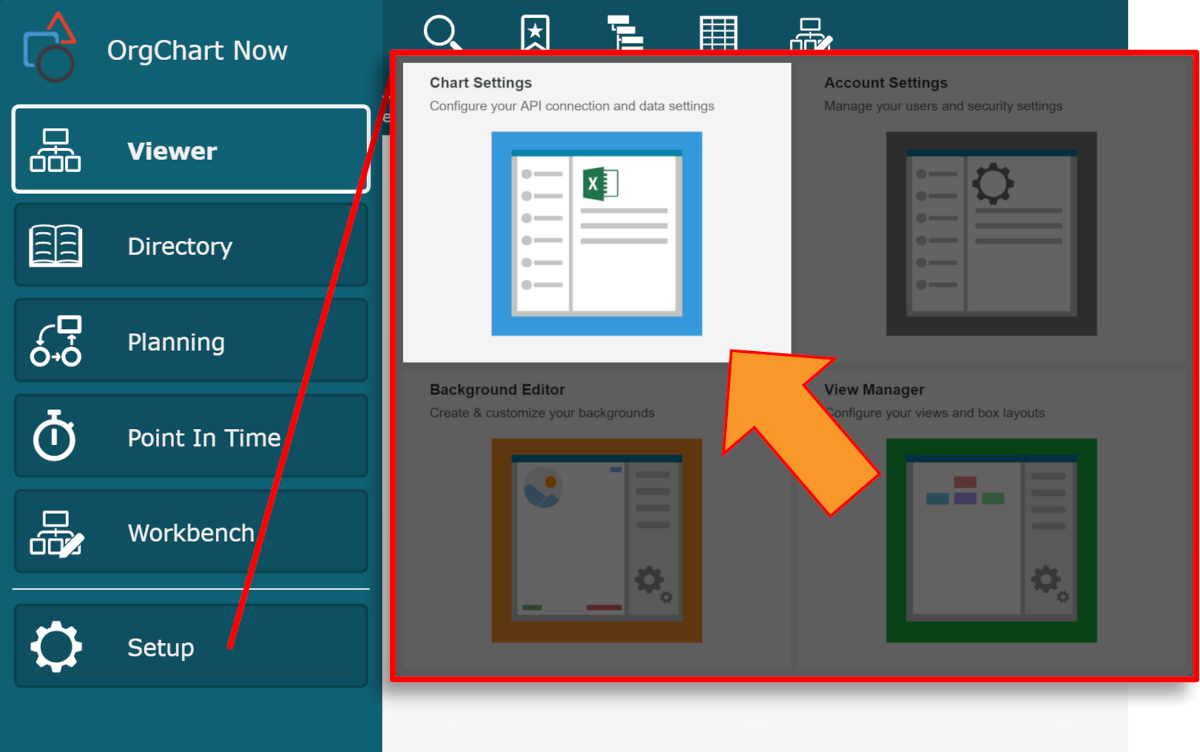
Click on the Chart Settings tile, and then click on the Presentation tab in the left side menu.
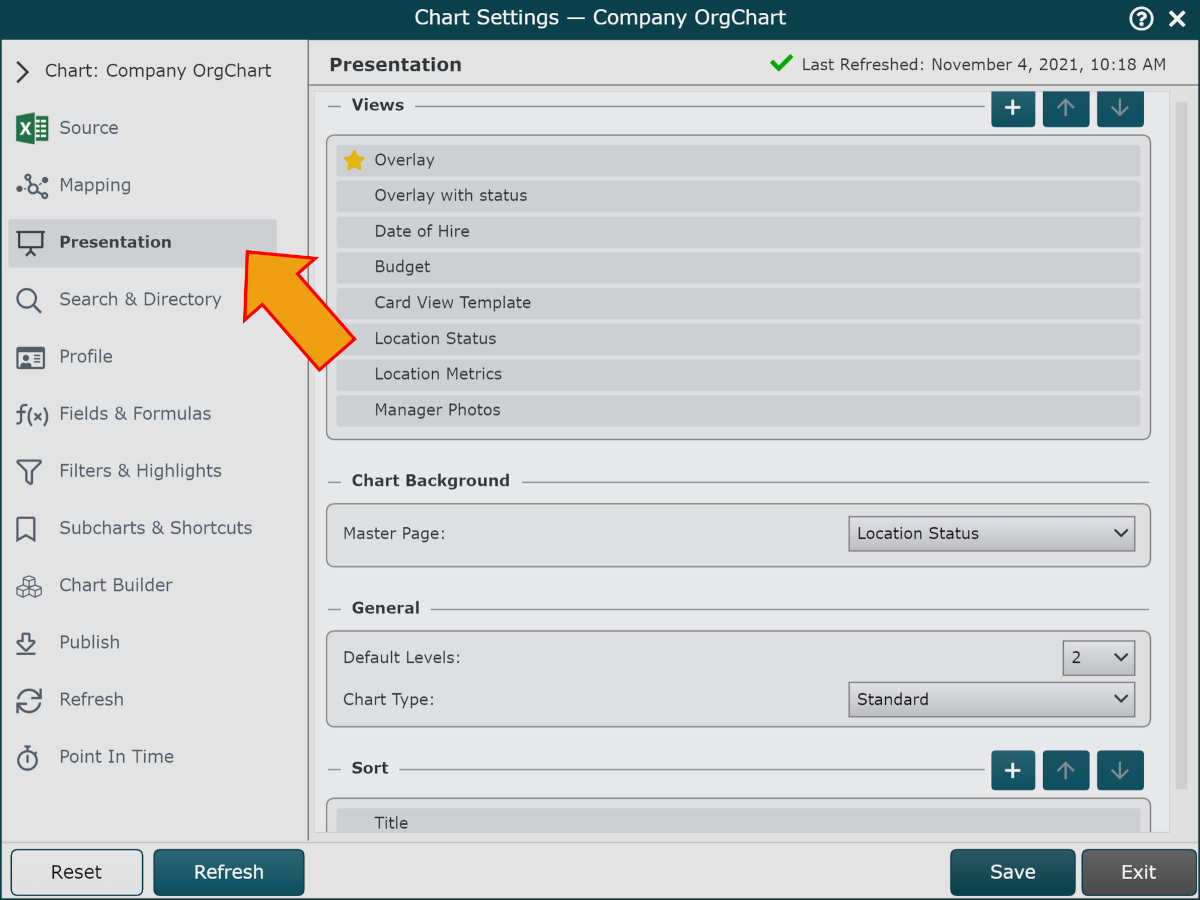
Click on the Chart Type dropdown menu (under the General heading), and then select the Level option.
Click on the Field dropdown menu that is now displayed under the Chart Type dropdown menu.
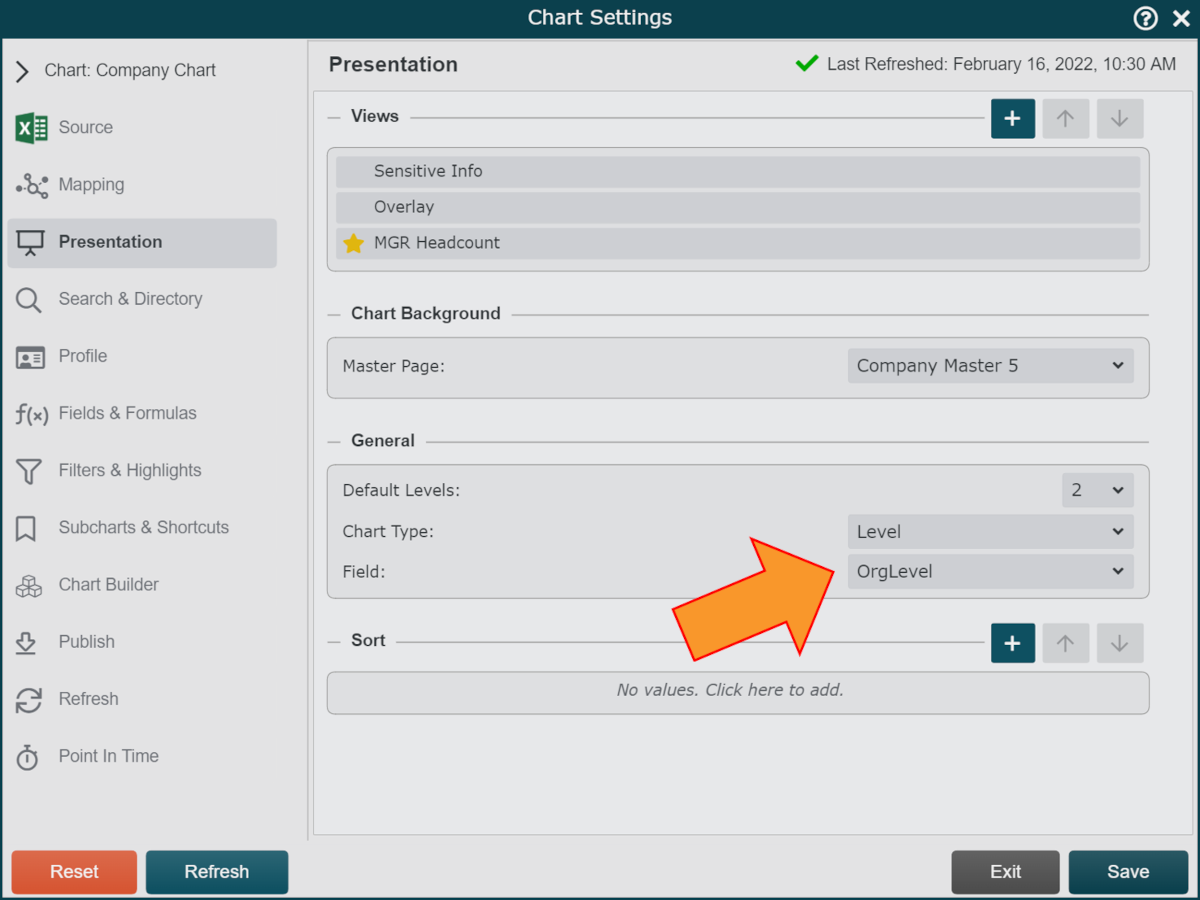
Select the field in the data that will dictate the level a employee will be displayed on the chart.
Click Save. The chart presentation is updated.