Creating a Master Chart
Audience
Audience: Administrators
Overview
A Master Chart is an automatically generated chart derived from one or more data sources. Master Charts are visible in Viewer mode and can be used to create custom Chart Documents.
Master Charts are managed in the Account Settings: Chart Management panel, where you can rename, reorder, delete. and add new ones.
Creating The First Master Chart
When first logging into your OrgChart account, you will see the following:
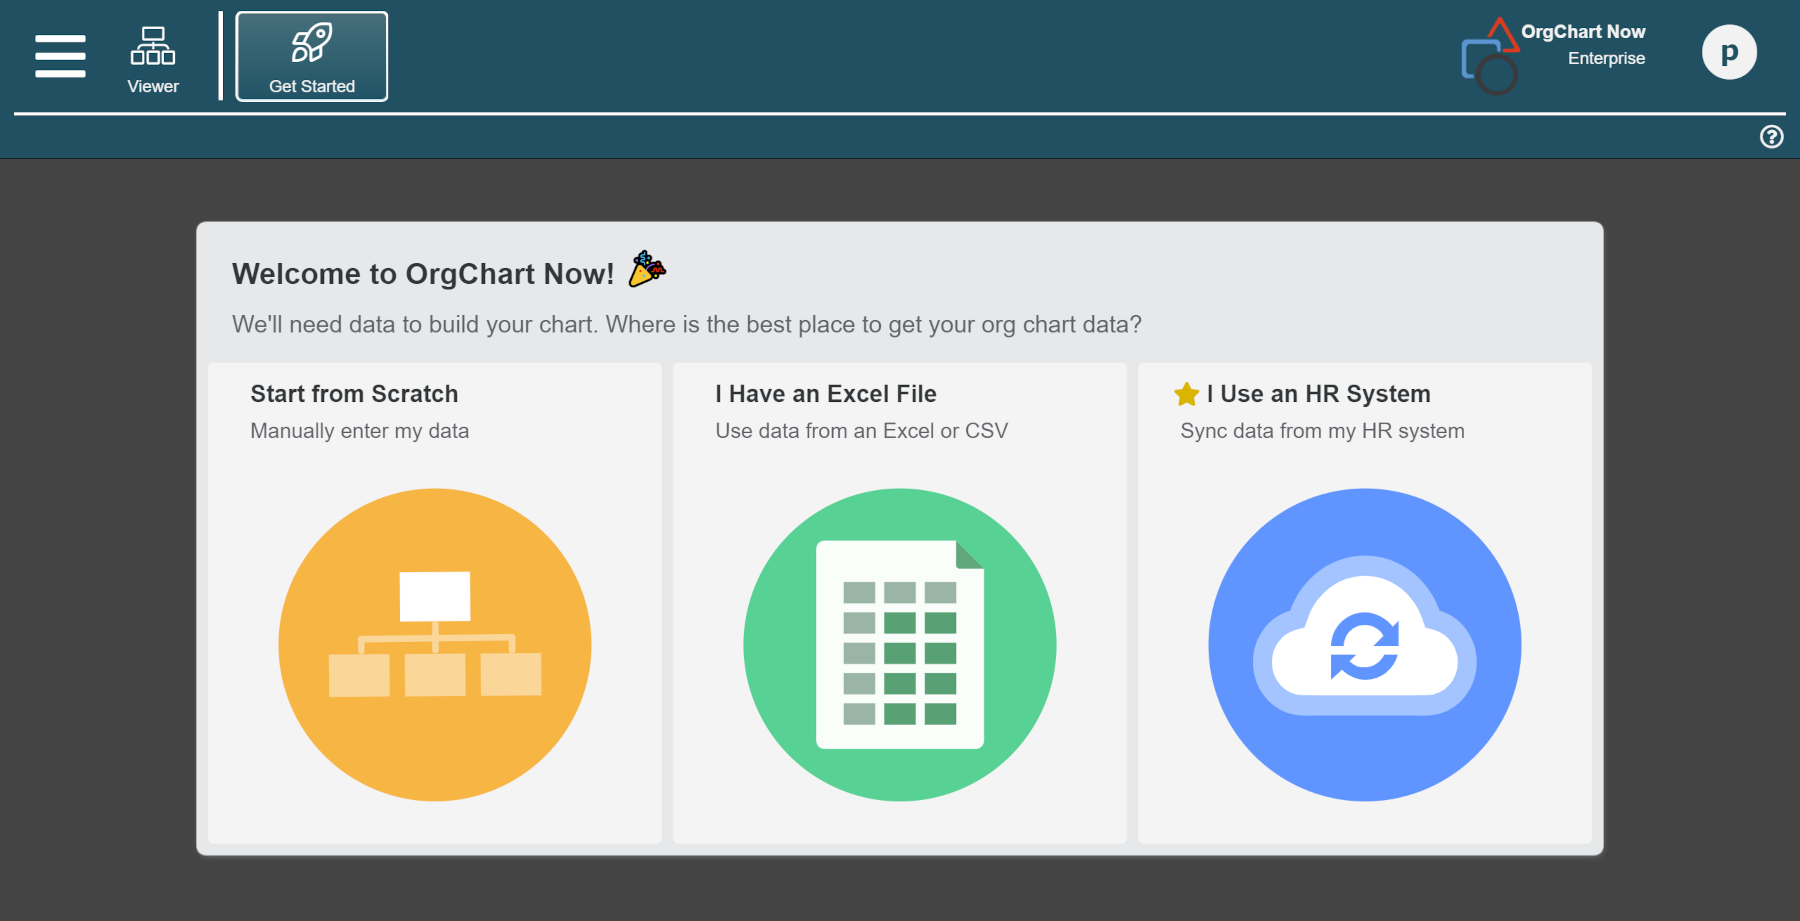
Click on one of the following three options to get started:
Start from Scratch - Select the number of employees in your organization and the types of data fields you'd like to use. Then, manually enter your data.
I Have an Excel File - Upload a file of your employee data, tell OrgChart how you want it to interpret your data, and then generate your chart.
I Use an HR System - Choose your HR system from our list of Connectors, enter your credentials, and then refresh to generate your chart.
Creating a New Master Chart
Administrators can add additional Master Charts to their account. This is useful for restricting data on import, or visualizing specific parts of your organization. The following section provides step-by-step instructions for adding a new Master Chart to your OrgChart account.
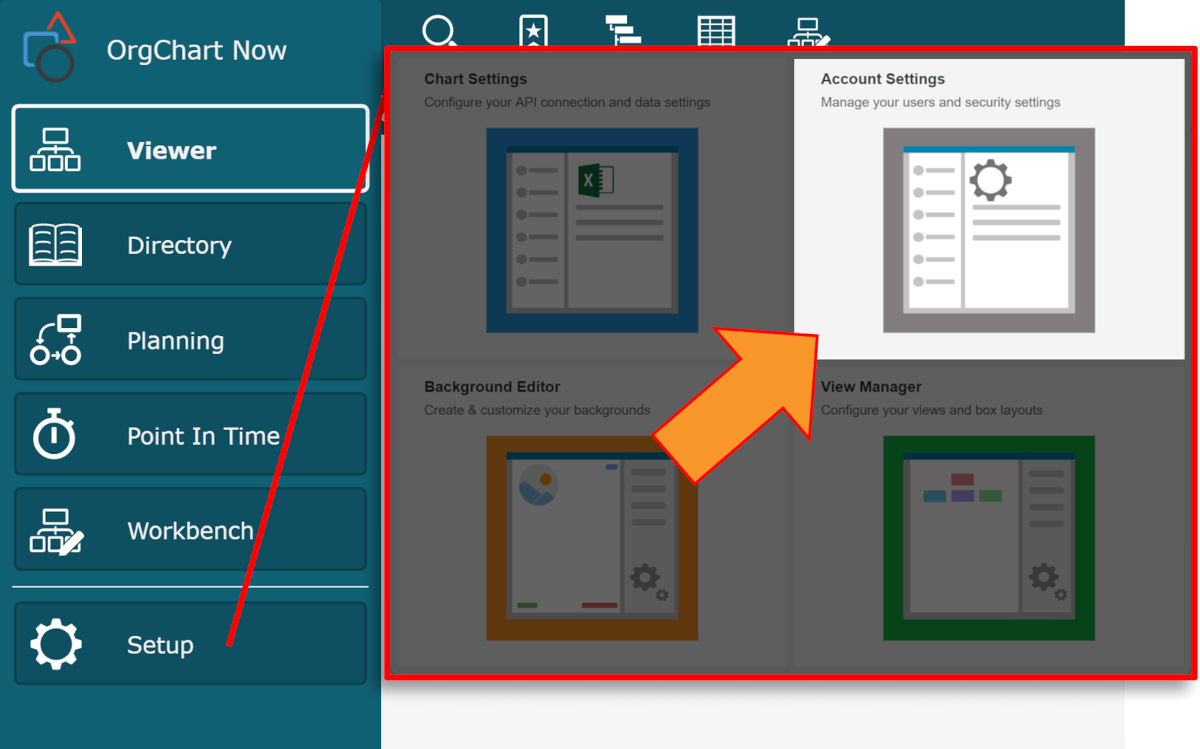
Click on the Mode Switcher icon in the Top Toolbar, and then select the Setup option. The Setup panel is displayed.
Click on the Account Settings tile.
Select the Chart Management option from the left side menu.
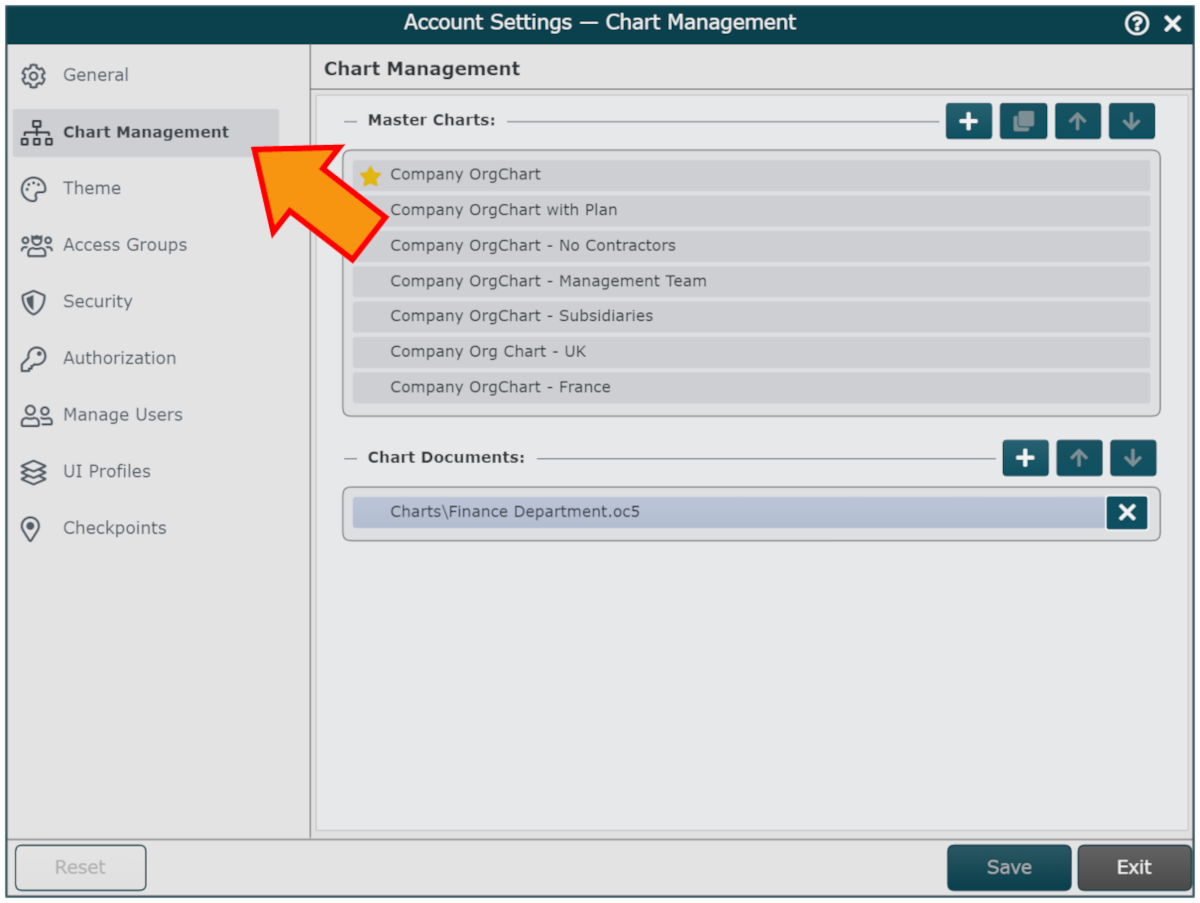
Click on the
 icon to the right of the Master Charts heading.
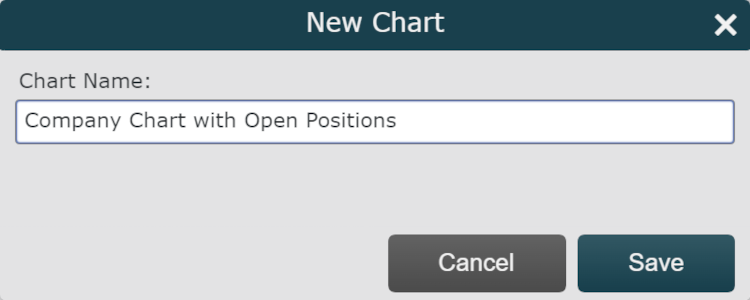
Enter a name for the Master Chart in the Chart Name text box, and then click on Save. The Main Data Source panel is displayed.
Select the connector from which your main data will be pulled.
Note
If you select Excel or CSV, reference the Flat File Prep article for information on how to format and upload your data.
Configure your Master Chart in the Chart Settings: Source panel that is displayed. Reference the associated Connector articles to properly set up your data connectors.
When prompted, click to Configure Mapping. The Chart Settings: Mapping panel is displayed.
Click on the Load Mapping button (in the top right corner), and ensure that OrgChart is interpreting your source data correctly.
Click on Save and Refresh. The Master Chart is automatically generated.
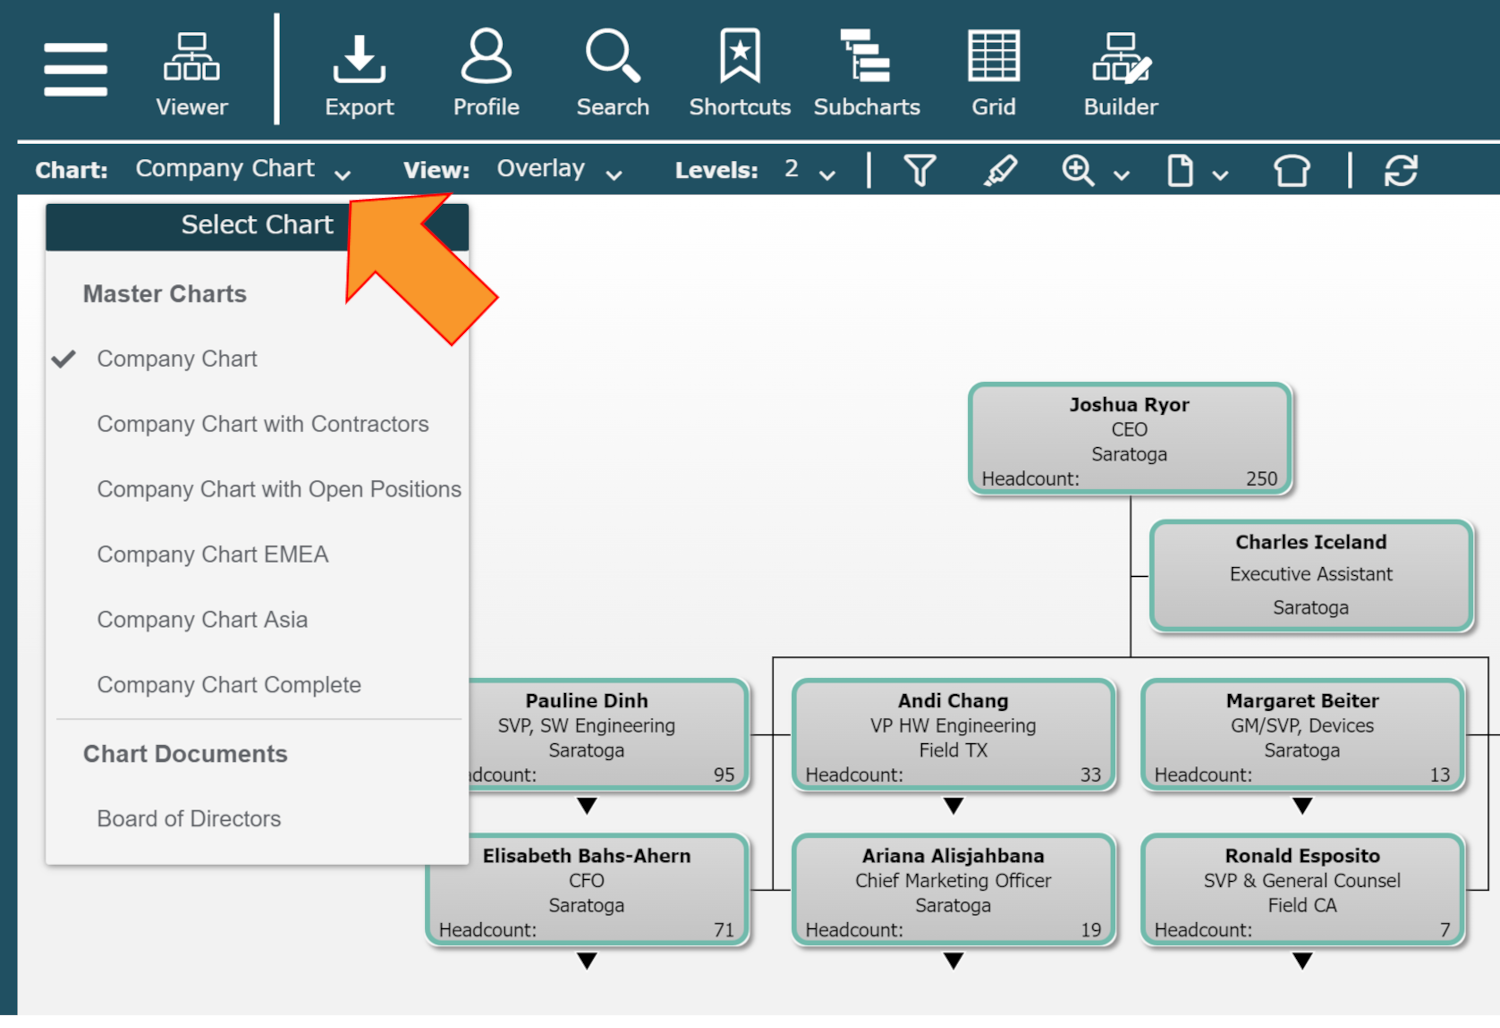
Opening Master Charts in Viewer
If you have more than more Master Chart in your account, you can toggle between them while in Viewer mode using the Chart menu.