Point-in-Time Charts
Audience
Audience: Any User Edition: Enterprise & Premium
Overview
Point-in-time charts, also known as archived charts or archives, are a new feature in OrgChart Now version 5.0. Previously, when data in a chart was refreshed, previous chart data was deleted. This is no longer the case.
OrgChart preserves a "snapshot" of previous versions of a chart in an archive which can be accessed at will by the user. These charts can then be loaded into the Workbench and manipulated like actual org charts, or compared against other versions.
Generating a Point-in-Time Chart
-
Select More > Chart Settings.
-
From the Settings drop-down list, select Point in Time. This will open the Point in Time panel.
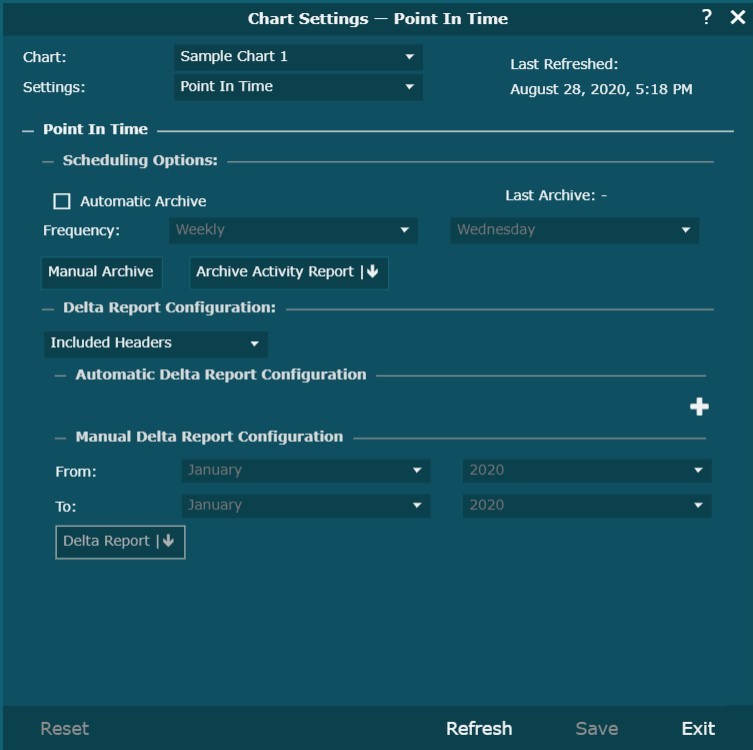
The panel is split into the following sections:
Scheduling Options
Here, administrators can select whether or not they want OrgChart to automatically create archives by checking the "Automatic Archive" box. If archives have already been created, the date of the last archive will be displayed on the right.
Below, in the drop-down lists, users can select the frequency with which they would like archives to be created, and on what day of the week, month, or quarter. Users can also select the Manual Archive button to create an archive manually (see below). Finally, there is also an Archive History button which users can use to browse previously created archives.
Delta Reporting Configuration
In this section, users can configure delta reports (downloadable Excel files which display the differences between versions of a chart). Administrators have the option of configuring an automatic delta report (by simply entering an email address; a delta report will be sent to this email address every time an automatic archive is generated).
Administrators can also manually configure delta reports by entering a span of time in which they would like to view changes. Selecting the Delta Report button will then generate a report showing changes over that time span.
When you've finished configuring archives and delta reports, click Save and then Exit.
Loading a Point-in-Time Chart
Point-in-Time charts can be loaded into OrgChart and viewed and manipulated like normal org charts.
-
Go to OrgChart Builder in Viewer by selecting the Workbench icon and selecting Builder.
-
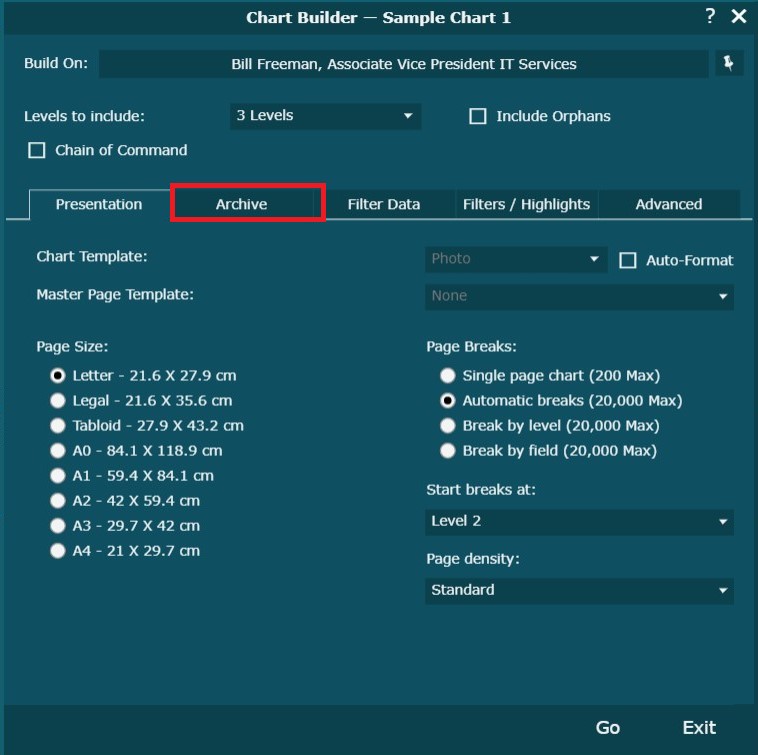
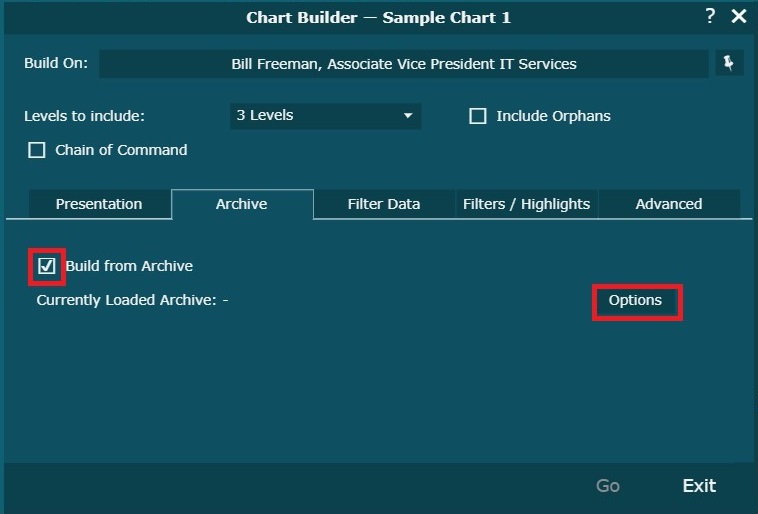
Select the Archive tab and check the box next to "Build from Archive".
-
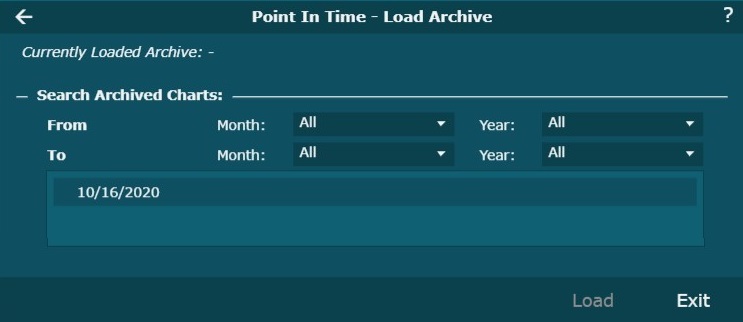
Select the Options button the checkbox, and select which archive you would like to build from.
-
When you've selected the desired archive, select Load and then select the Back Arrow. You will now see your currently loaded archive.
-
Select the Go button.
Building a Point-in-Time Chart
Having completed the previous steps, you can now build from the archived chart. Take note that all refresh options under the Home and Refresh ribbons will be greyed out.